


At the end of every year, we like to read through some of the major reports on inbound marketing, content marketing, social media, and online behavior.
It’s amazing how fast things can change in 12 short months — and 2016 was certainly no exception.
Download 195+ visual marketing design templates to use for social media posts, infographics, and more.
This year, we’ve seen the importance of visual content emphasized by the changes that occurred across almost every major social network, including Facebook, Snapchat, Instagram, and Twitter. At the same time, videos have become powerful tools for brands looking to communicate more easily with their readers.
To help you keep pace with these trends, let’s take a look at some marketing statistics that demonstrate the impact visual content has on reach, engagement, and sales. The stats are categorized by General Visual Content, Video, Emerging Visual Marketing, Infographics, and Social Media.
(Want to learn more about content creation, strategy, and promotion? Take our free Content Marketing Certification course.)
42 Stats You Should Know About Visual Content Marketing in 2017
General Visual Content Statistics
1) 37% of marketers said visual marketing was the most important form of content for their business, second only to blogging (38%). (Source)
2) 74% of social media marketers use visual assets in their social media marketing, ahead of blogs (68%) and videos (60%). (Source)
3) When people hear information, they’re likely to remember only 10% of that information three days later. However, if a relevant image is paired with that same information, people retained 65% of the information three days later. (Source)
4) B2C marketers place greater importance on visual content than B2B marketers. (Source)
5) 51% of B2B marketers prioritized creating visual content assets in 2016. (Source)

Source: Content Marketing Institute
Video Marketing Statistics
6) By 2017, video content will represent 74% of all internet traffic. (Source)
7) Cisco projects that global internet traffic from videos will make up 80% of all internet traffic by 2019. (Source)
8) 76.5% of marketers and small business owners in an Animoto survey who have used video marketing say it had a direct impact on their business. (Source)
9) 34% of B2C marketers say pre-produced video will be critical to content marketing success in 2017. (Source)
10) 4X as many consumers would prefer to watch a video about a product than to read about it. (Source)
11) More than 60% of marketers and small business owners said they planned to increase investment in video marketing in 2017. (Source)
12) 62% of B2B marketers rated videos as an effective content marketing tactic in 2016. (Source)
13) Using the word “video” in an email subject line boosts open rates by 19% and clickthrough rates by 65%. (Source)
14) In a 2016 HubSpot survey, 43% of consumers wanted to see more video content in 2016. (Source)
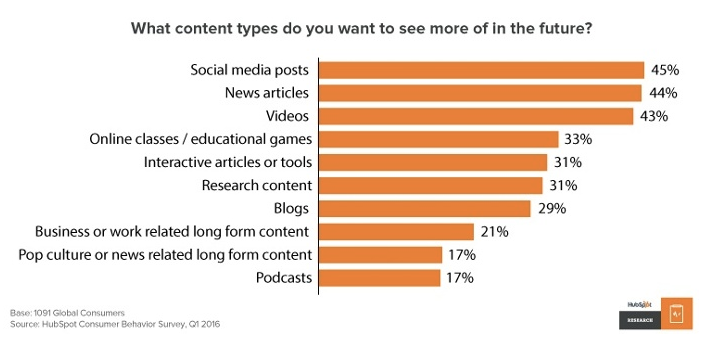
Source: HubSpot Research
Emerging Visual Marketing Trends
15) In 2016, 14% of marketers used live video. (Source)
16) Facebook users spend 3X more time watching live videos than traditional videos. (Source)
17) 51% of all video plays are on mobile devices — this growth represents a 15% increase from 2015 and a 203% increase from 2014. (Source)

Source: Ooyala
18) Videos under five minutes in length account for 55% of total video consumption time on smartphones. (Source)
19) Magnifyre found that 29% more people viewed a 360-degree video than the same video in traditional format. (Source)
20) 85% of adults consume content on multiple devices at the same time. (Source)
Infographic Stats
21) Eye-tracking studies show internet readers pay close attention to information-carrying images. In fact, when the images are relevant, readers spend more time looking at the images than they do reading text on the page. (Source)
22) Infographics are «liked» and shared on social media 3X more than other any other type of content. (Source)

Source: MassPlanner
23) Infographics were the B2B content marketing tactic with the biggest increase in use, from 2015 to 2016, up from 50% to 58%. (Source)
24) People following directions with text and illustrations do 323% better than people following directions without illustrations. (Source)

Source: NeoMam
Social Media Stats
25) Tweets with images receive 150% more retweets than tweets without images. (Source)
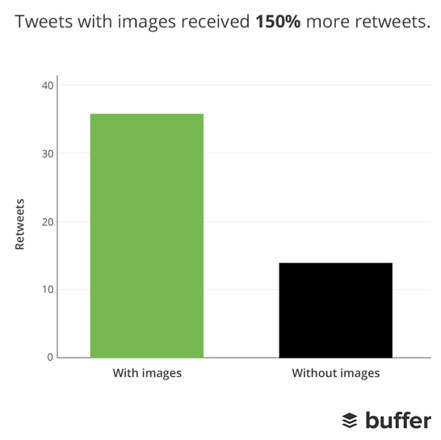
Source: Buffer
26) In an analysis of over 1 million articles, BuzzSumo found that articles with an image once every 75-100 words received double the social media shares as articles with fewer images. (Source)
27) Facebook posts with images see 2.3X more engagement than those without images. (Source)

Source: BuzzSumo
28) The equivalent of 110 years of live video is watched on Periscope every day. (Source)

Source: Periscope
29) There were more than 500 million Instagram users in June 2016. (Source)
30) 55% of marketers chose Facebook as their most important social media platform. (Source)
31) 85% of videos on Facebook are watched without sound. (Source)
32) Facebook users watch 8 billion videos per day. (Source)
33) Snapchat users watch 10 billion videos per day. (Source)
34) Snapchat users share 9,000 photos per second. (Source)
35) Organic engagement on Facebook more than doubled in 2015, while organic engagement on Instagram almost halved. (Source)

Source: Forrester Research
36) Organic Facebook engagement is highest on posts with videos (13.9%) and photos (13.7%). (Source)
37) Snapchat had 150 million daily active users in June 2016 — up from 110 million in December 2016. (Source)
38) 44% of online women use Pinterest, compared to 16% of online men. (Source)

Source: Pew Research Center
39) Shopify users referred by Pinterest spend an average of $80 compared to the Facebook referral average of $40. (Source)

Source: Jeff Bullas

